ADO
Date
Jan 2023 - Aug 2024
Client
Anaplan
Business impact
Contracts that secured business with major customers across 3, 4 and 5 years
Delivered a new, high value product to customers in 18 months
Licenses bought at $500,000 per customer
Brought revenue into Anaplan instead of third party ETL tools
UX impact
Finally created a scheduling solution that met many personas requirements
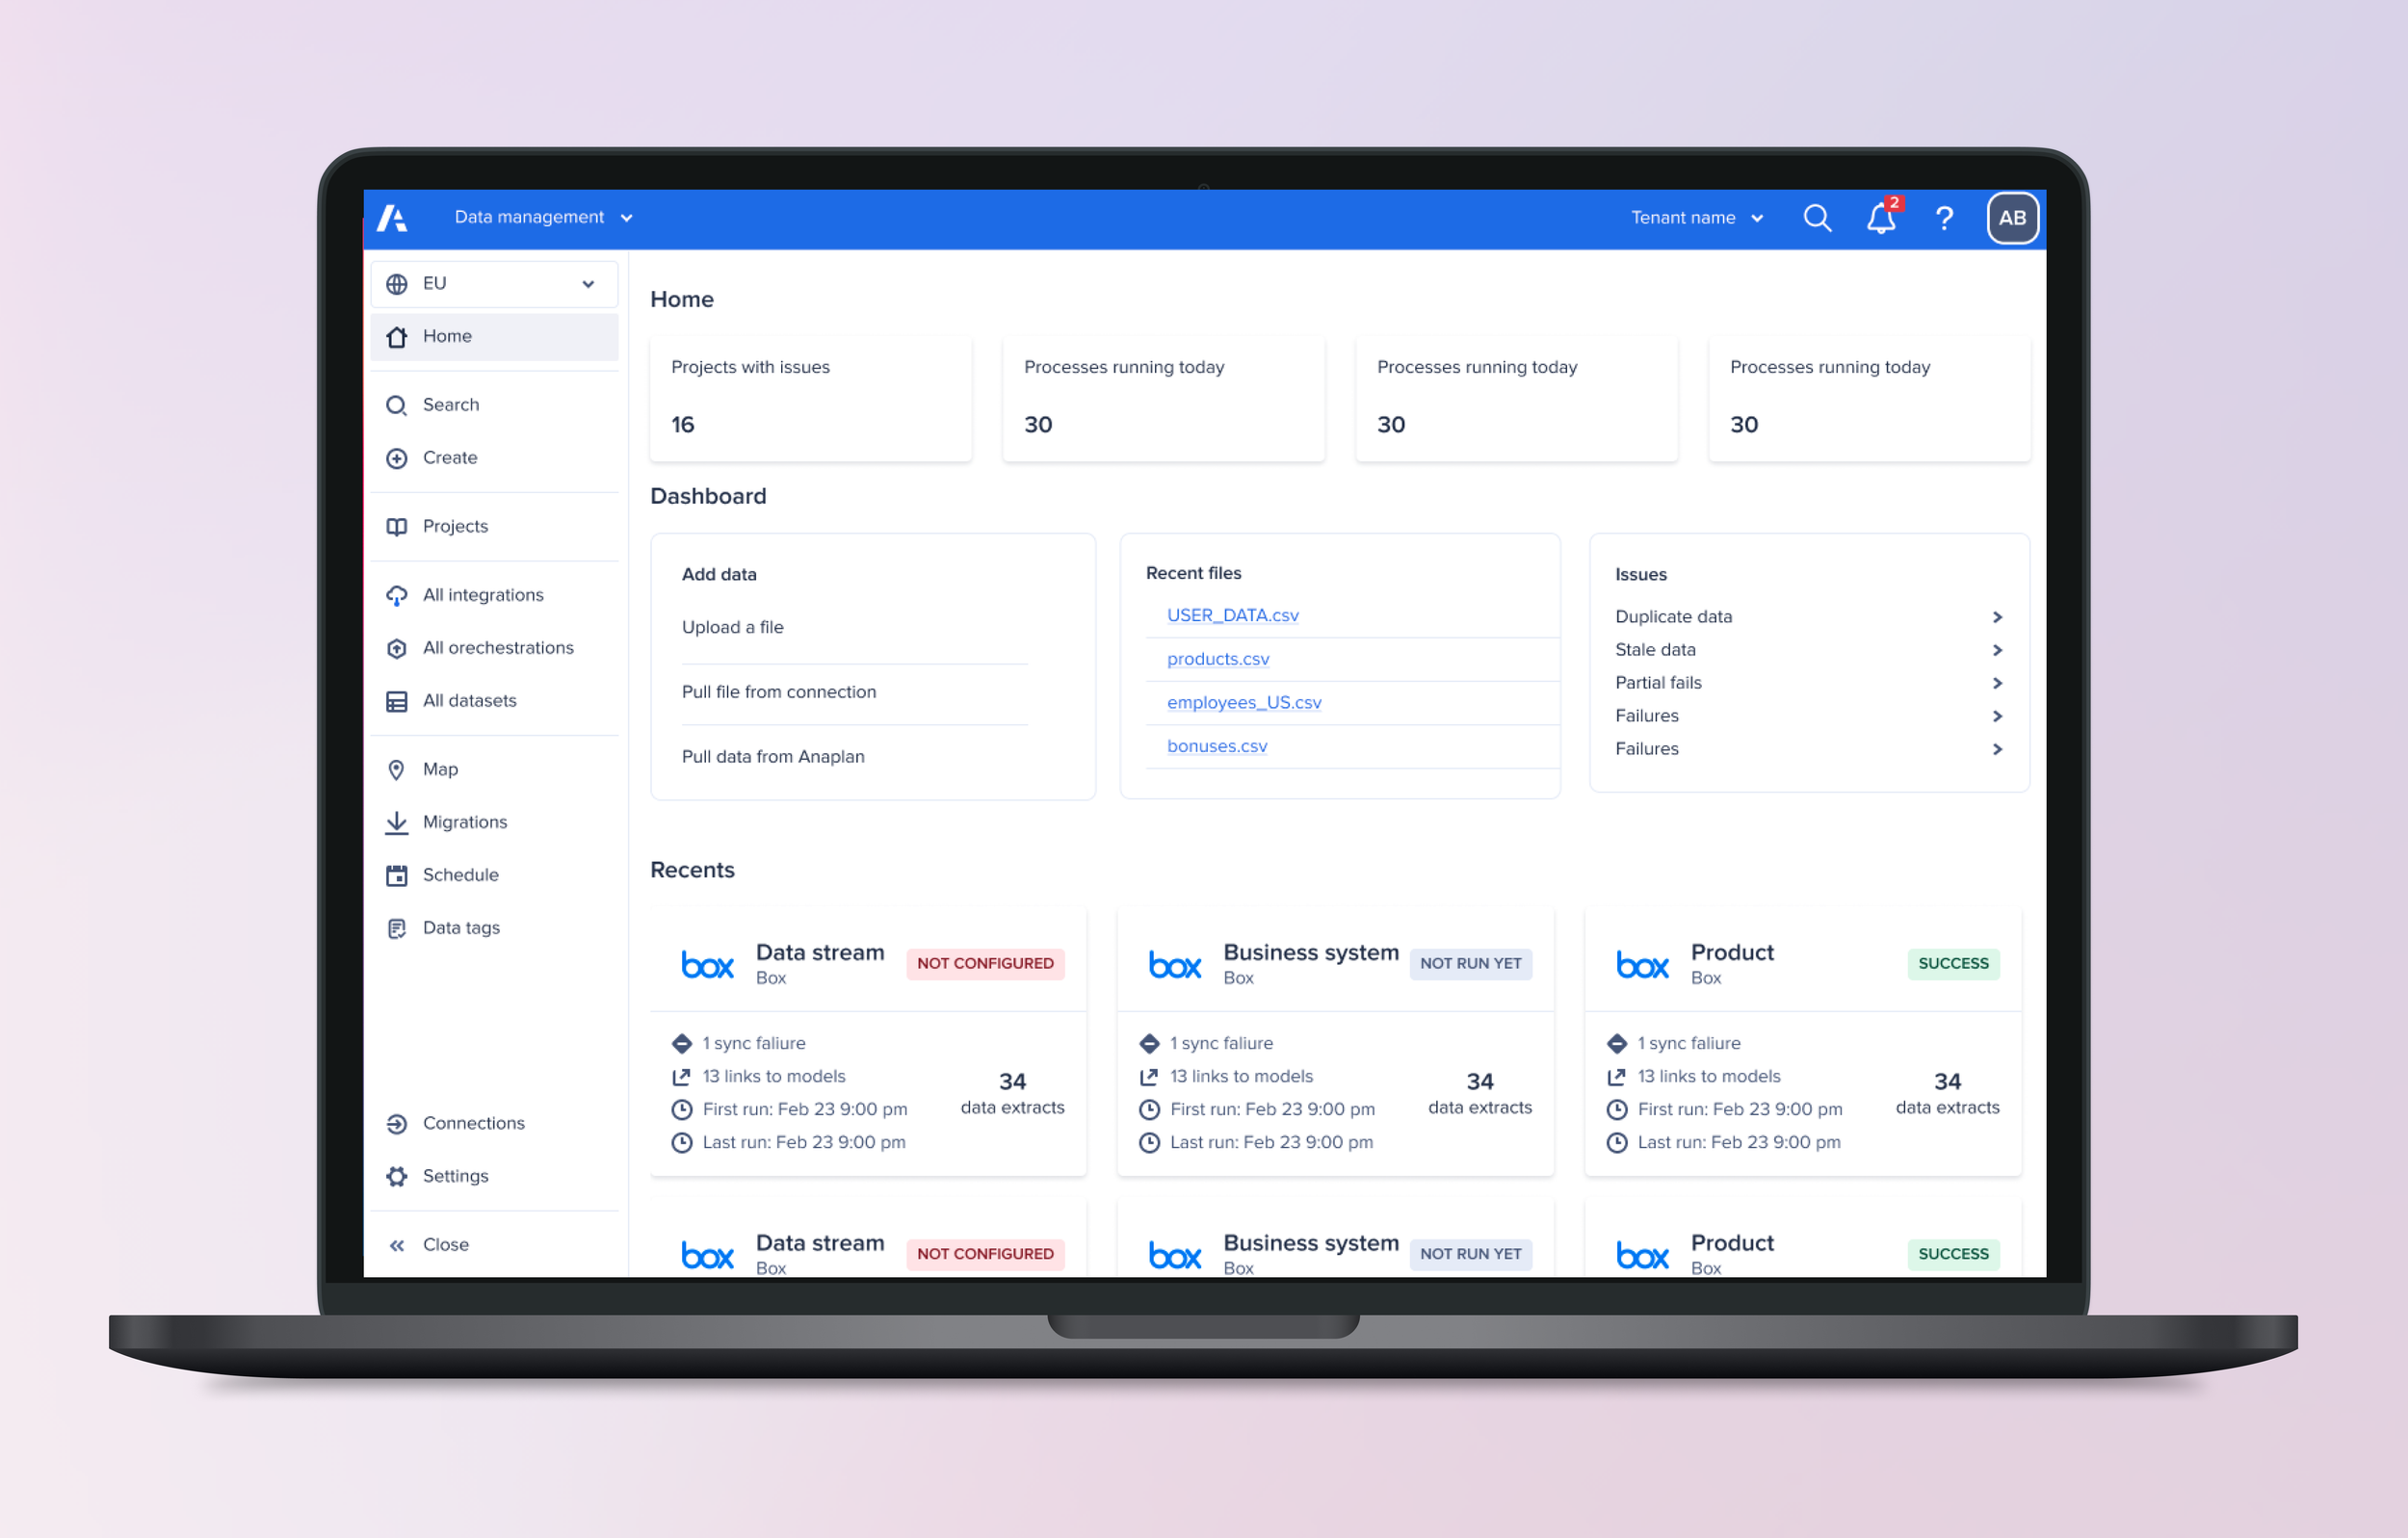
Allowed users to complete all their data management processes in one convenient place
Gained customer trust in Anaplan to manage their data and much needed visibility on their processes in Anaplan
Achieved end to end data orchestration which was an essential feature to release and sell the ADO product
“I want to acknowledge the tremendous efforts of our UX team members who have contributed to ADO. Whether you are a UX designer, content designer, or researcher, and whether you were involved from the project's inception or joined later on, your work has played a pivotal role in the success of this crucial project. Last week's GA milestone represents a groundbreaking moment in how our customers manage their data, and I eagerly anticipate the positive impact it will bring. Thank you all for your resilience, creativity, and dedication. Let's keep up the great work! Go team!” — UX director at Anaplan Pam Polizzi

Key details and skills
Number of designers: 5
Teams collaborated with: 3
Project timeframe: 18~ months
Skills used: Project management, design thinking, wire-framing, prototyping, user research - interviewing and analysis, pair designing, workshop facilitation, stakeholder management
ADO stands for Anaplan Data Orchestrator
Problem to be solved
There was a large gap in Anaplans product - customers did not have visibility of their data management and had to rely on multiple tools to shape and run their data processes. Additionally the scale of their data processes was huge with ~90,000 integrations run on the platform in a day for 1000 customers.
What we needed to achieve was an all-in-one data management solution that would allow users to pull their data from their source, transform it and shape it how they wanted and either send to their Anaplan data models or then export it elsewhere.
We also wanted to make their processes more automated so quality checks didn’t have to be run manually and so that they could automate the running of processes.
Challenges
Engineering led project so we had to advocate for user-centred design and proper design thinking processes
Short time frame to deliver a huge new product
Scheduling based on finance teams calendars - many high value customers have very custom schedules
The scale of data being managed was huge - we needed to consider scale and dependencies so customers can easily find what they want but also view status easily
The product manager was very stretched and as a result design had to take on project management responsibilities and help to strategise
Process
Who I worked with
I worked with a team of 2 senior designers, myself and 2 junior designers. We worked across 2 small engineering teams with a mixture of front end and back end developers. There was a project manger but they were very stretched and we struggled to get much time with them.
What I achieved
Multiple workshops and knowledge sharing sessions with the design team to train the team on this new product space
Over 8 high level complex feature areas
I led 3 research studies and attended many others which were related to this product
Establish a successful process for working with engineering and defining requirements for features with minimal PM input
Through research and feedback sessions on early wireframes I demonstrated the benefit of user centred design
How I worked
As a result, as a designer I had to work closely with engineering to define requirements and strategy and then report once a week with the rest of the design team to product management. I also worked with research to understand what previous studies had revealed about our customers expectations for this area of the product as customers had been asking for this solution for years. I also led research sessions (interviews and A/B testing) and worked directly with customers to understand their needs. I hosted pair design sessions with other designers to ensure consistency in our various product areas - I also mentored the more junior members of the team and supported them in their design solutions.
I also participated in and led vision design sessions in-office over a few days so we could present our vision back to the head of product and the head of engineering, but also to help define the feature work for the next couple of quarters.
Feature deep dive
Data Map
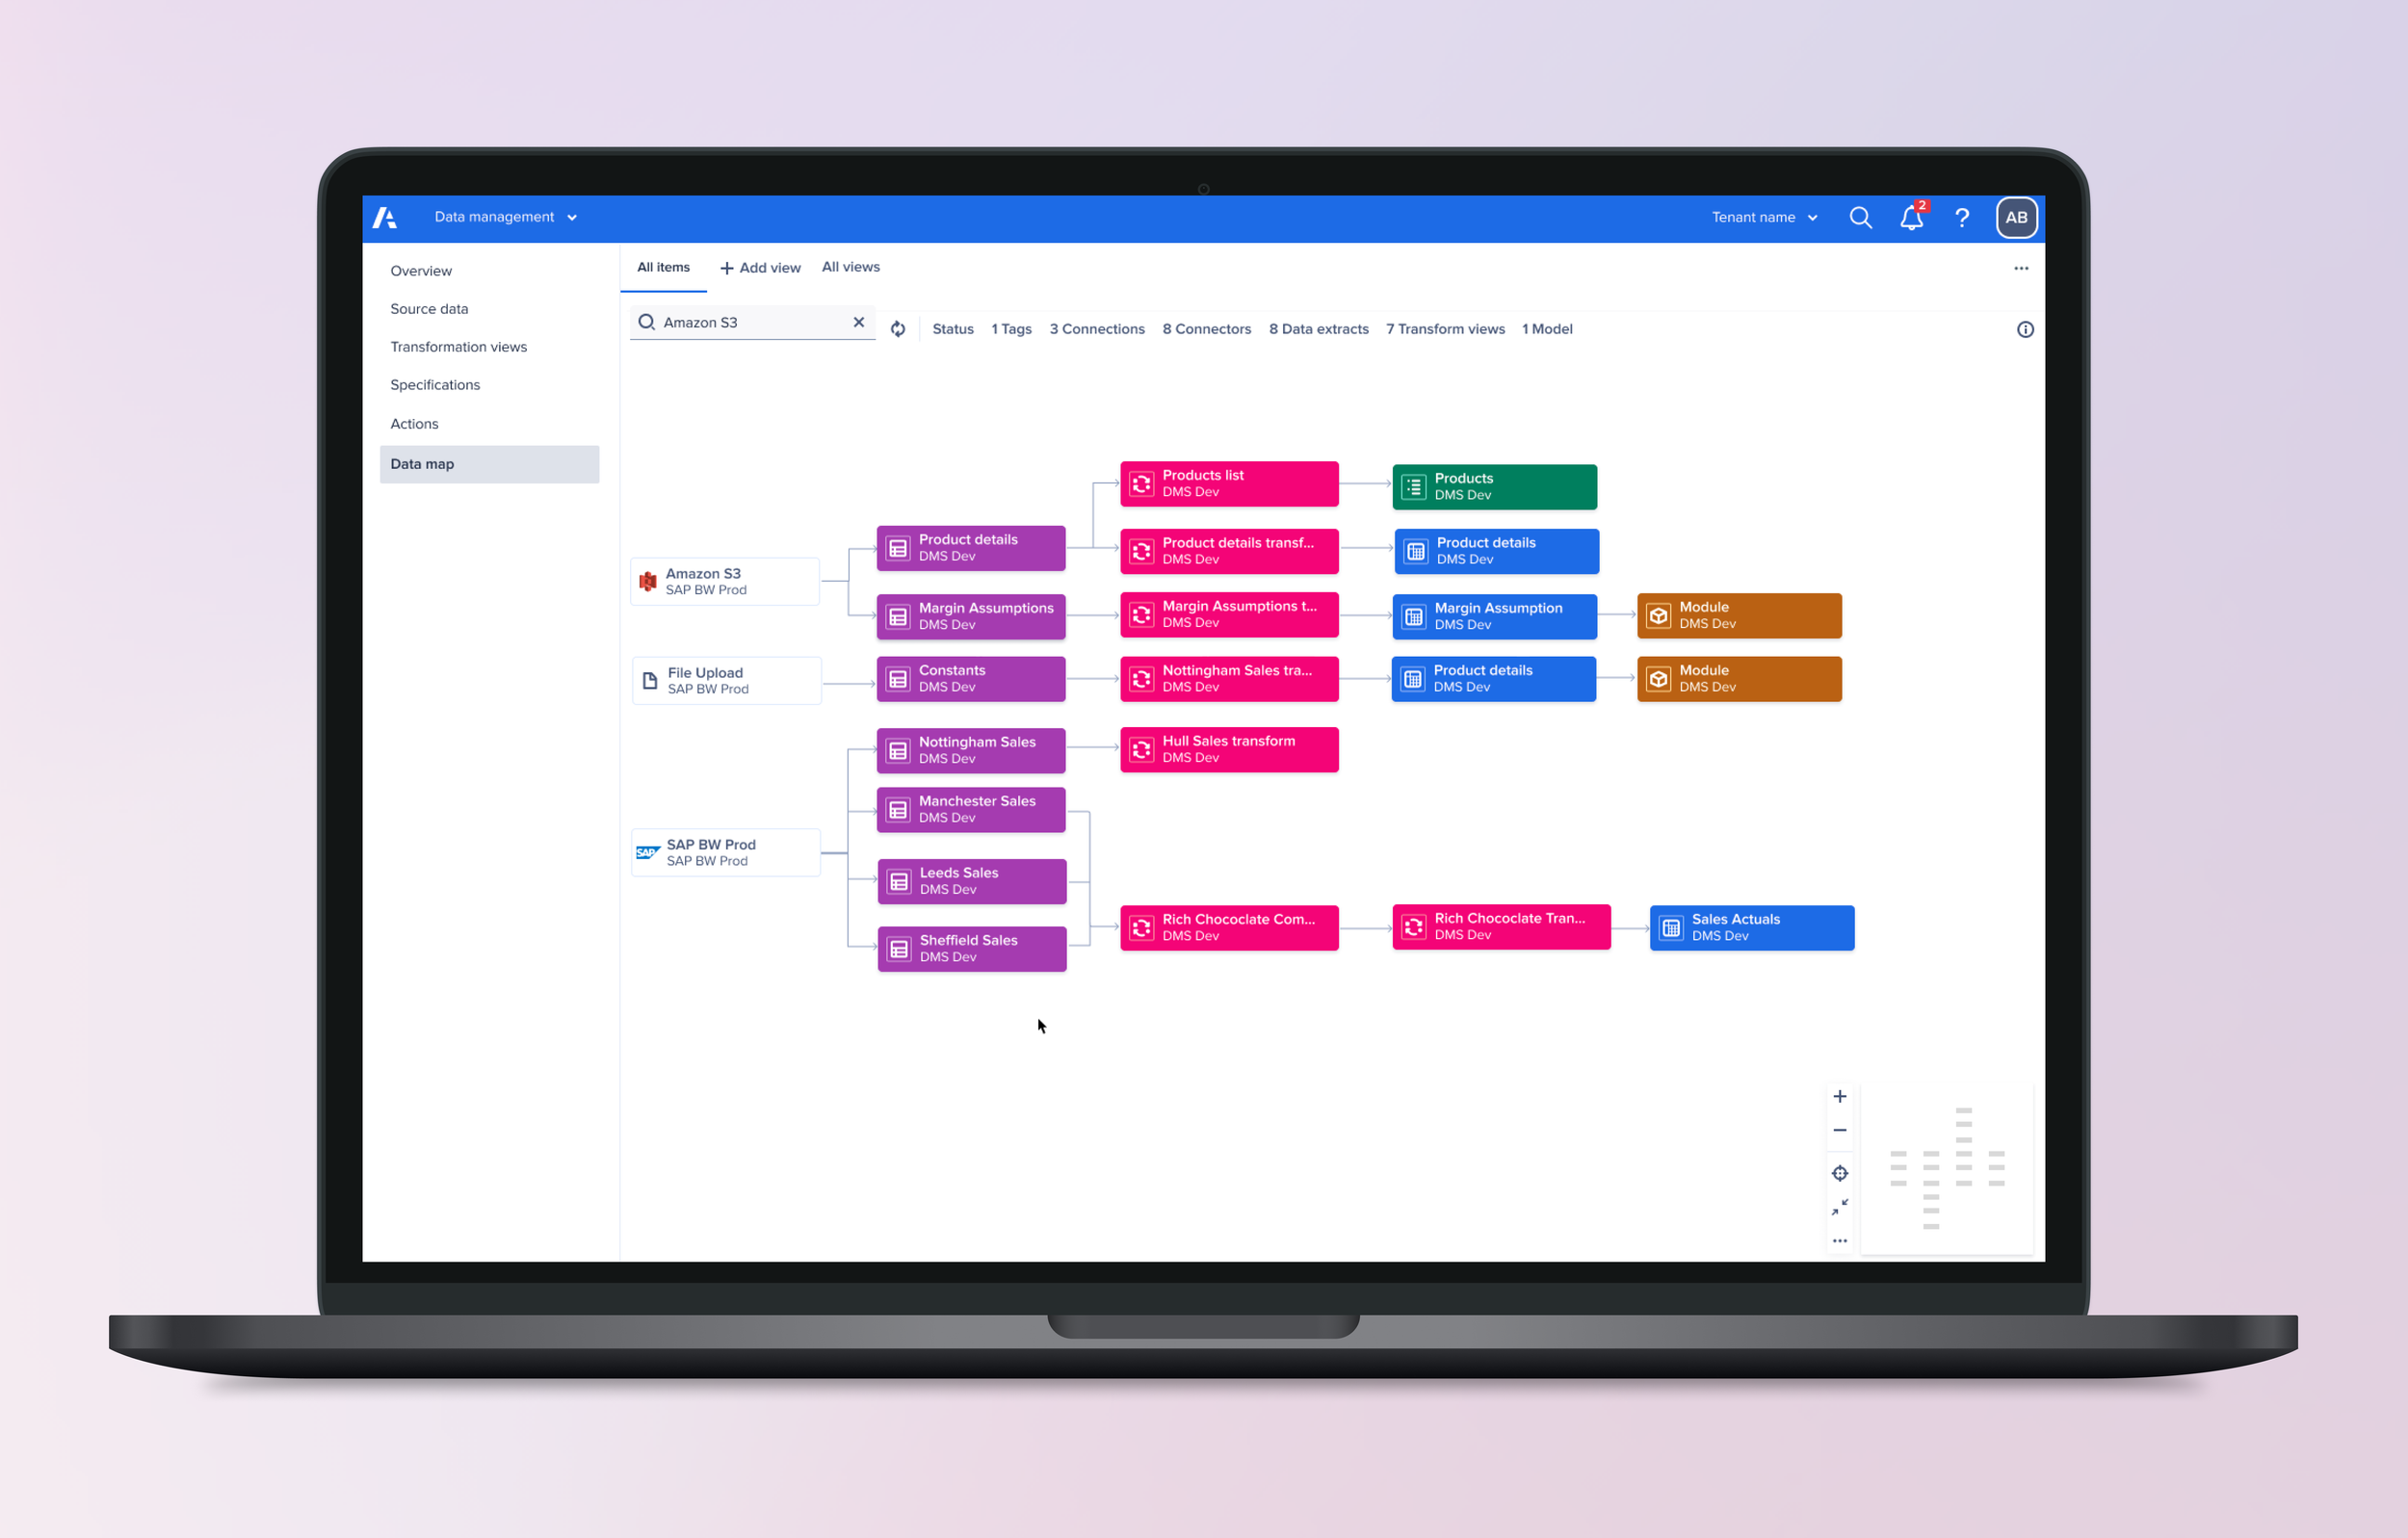
This feature was highly important for the usability of ADO as it gave users a visualisation of their data flow and and helped them to understand where their data was moving. This meant we freed up the mental load from customers and gave them visibility they would never have if they relied on third party tools instead of Anaplan, and helped us convince them to bring their revenue into Anaplan instead of 3rd party ETL tools.
This project began with the engineers creating a POC and they hadn’t accounted for scale at all. The initial view was a zoomed out map with thousands of integrations on one screen with no open to filter down the view. Users had to move the screen with their mouse and this was not accessible. I implemented a search and filters which were keyboard accessible, as well as the ability to use the keyboard to navigate within your filtered selection. Users could then use enter to open panels with additional information. This solution benefitted all users as it made the initial map view much less overloading and much easier to navigate.
Original engineering POC
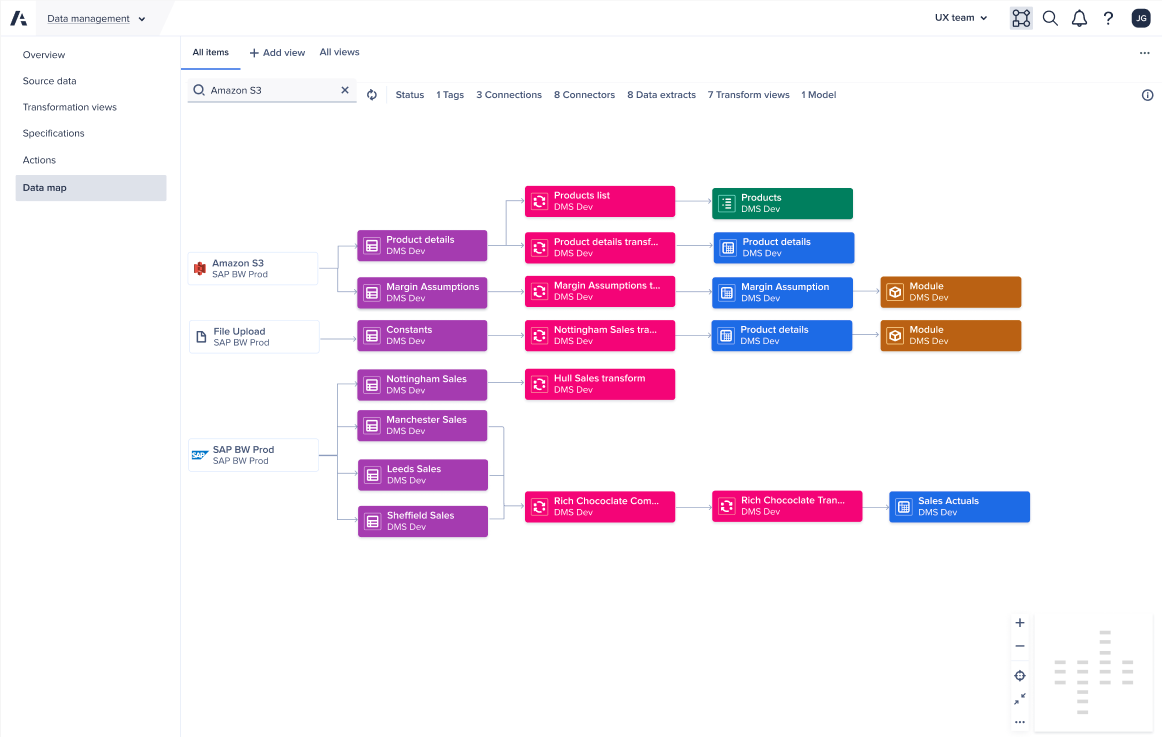
Added filters and search functionality
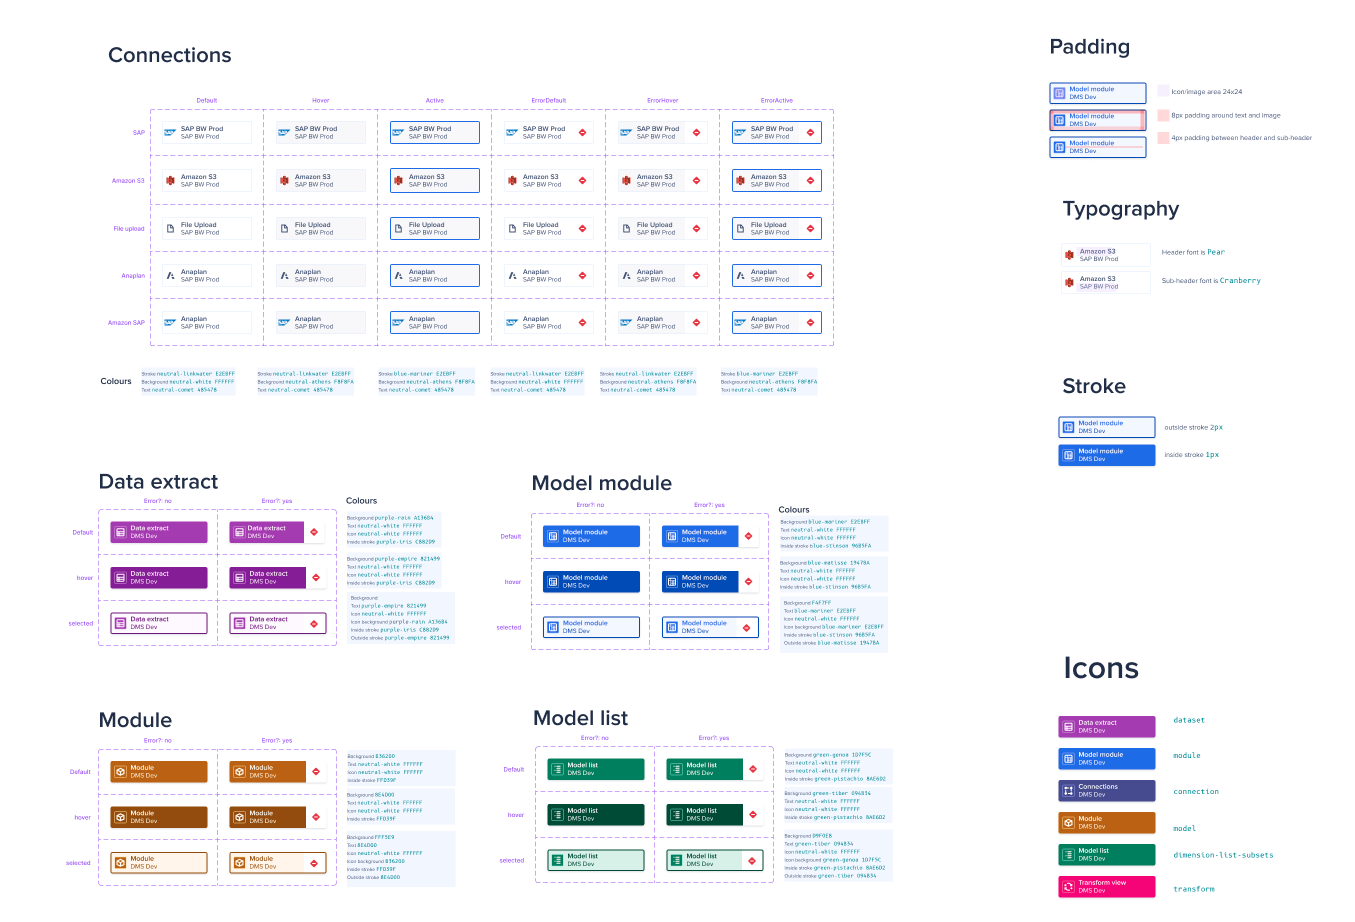
We also required components that didn’t yet exist in our design system and as a result we had to create custom components. The UI spec needed to be very detailed as the team building it were not front-end engineers. As a result I provided extra support and quality control to ensure our vision was implemented in the product. The initial colours chosen by engineers looked as though they represented status (red, yellow and green) when in fact they just showed data type. So I worked on new colours that showed our users who could see colours the different types, for accessibility I added clear icons with tooltips so that users with vision impairments could recognise the data types in the integrations. It was also important to make sure decorative elements were also read to screen readers so they could hear the integration type and then the name as they worked through the integration flow.
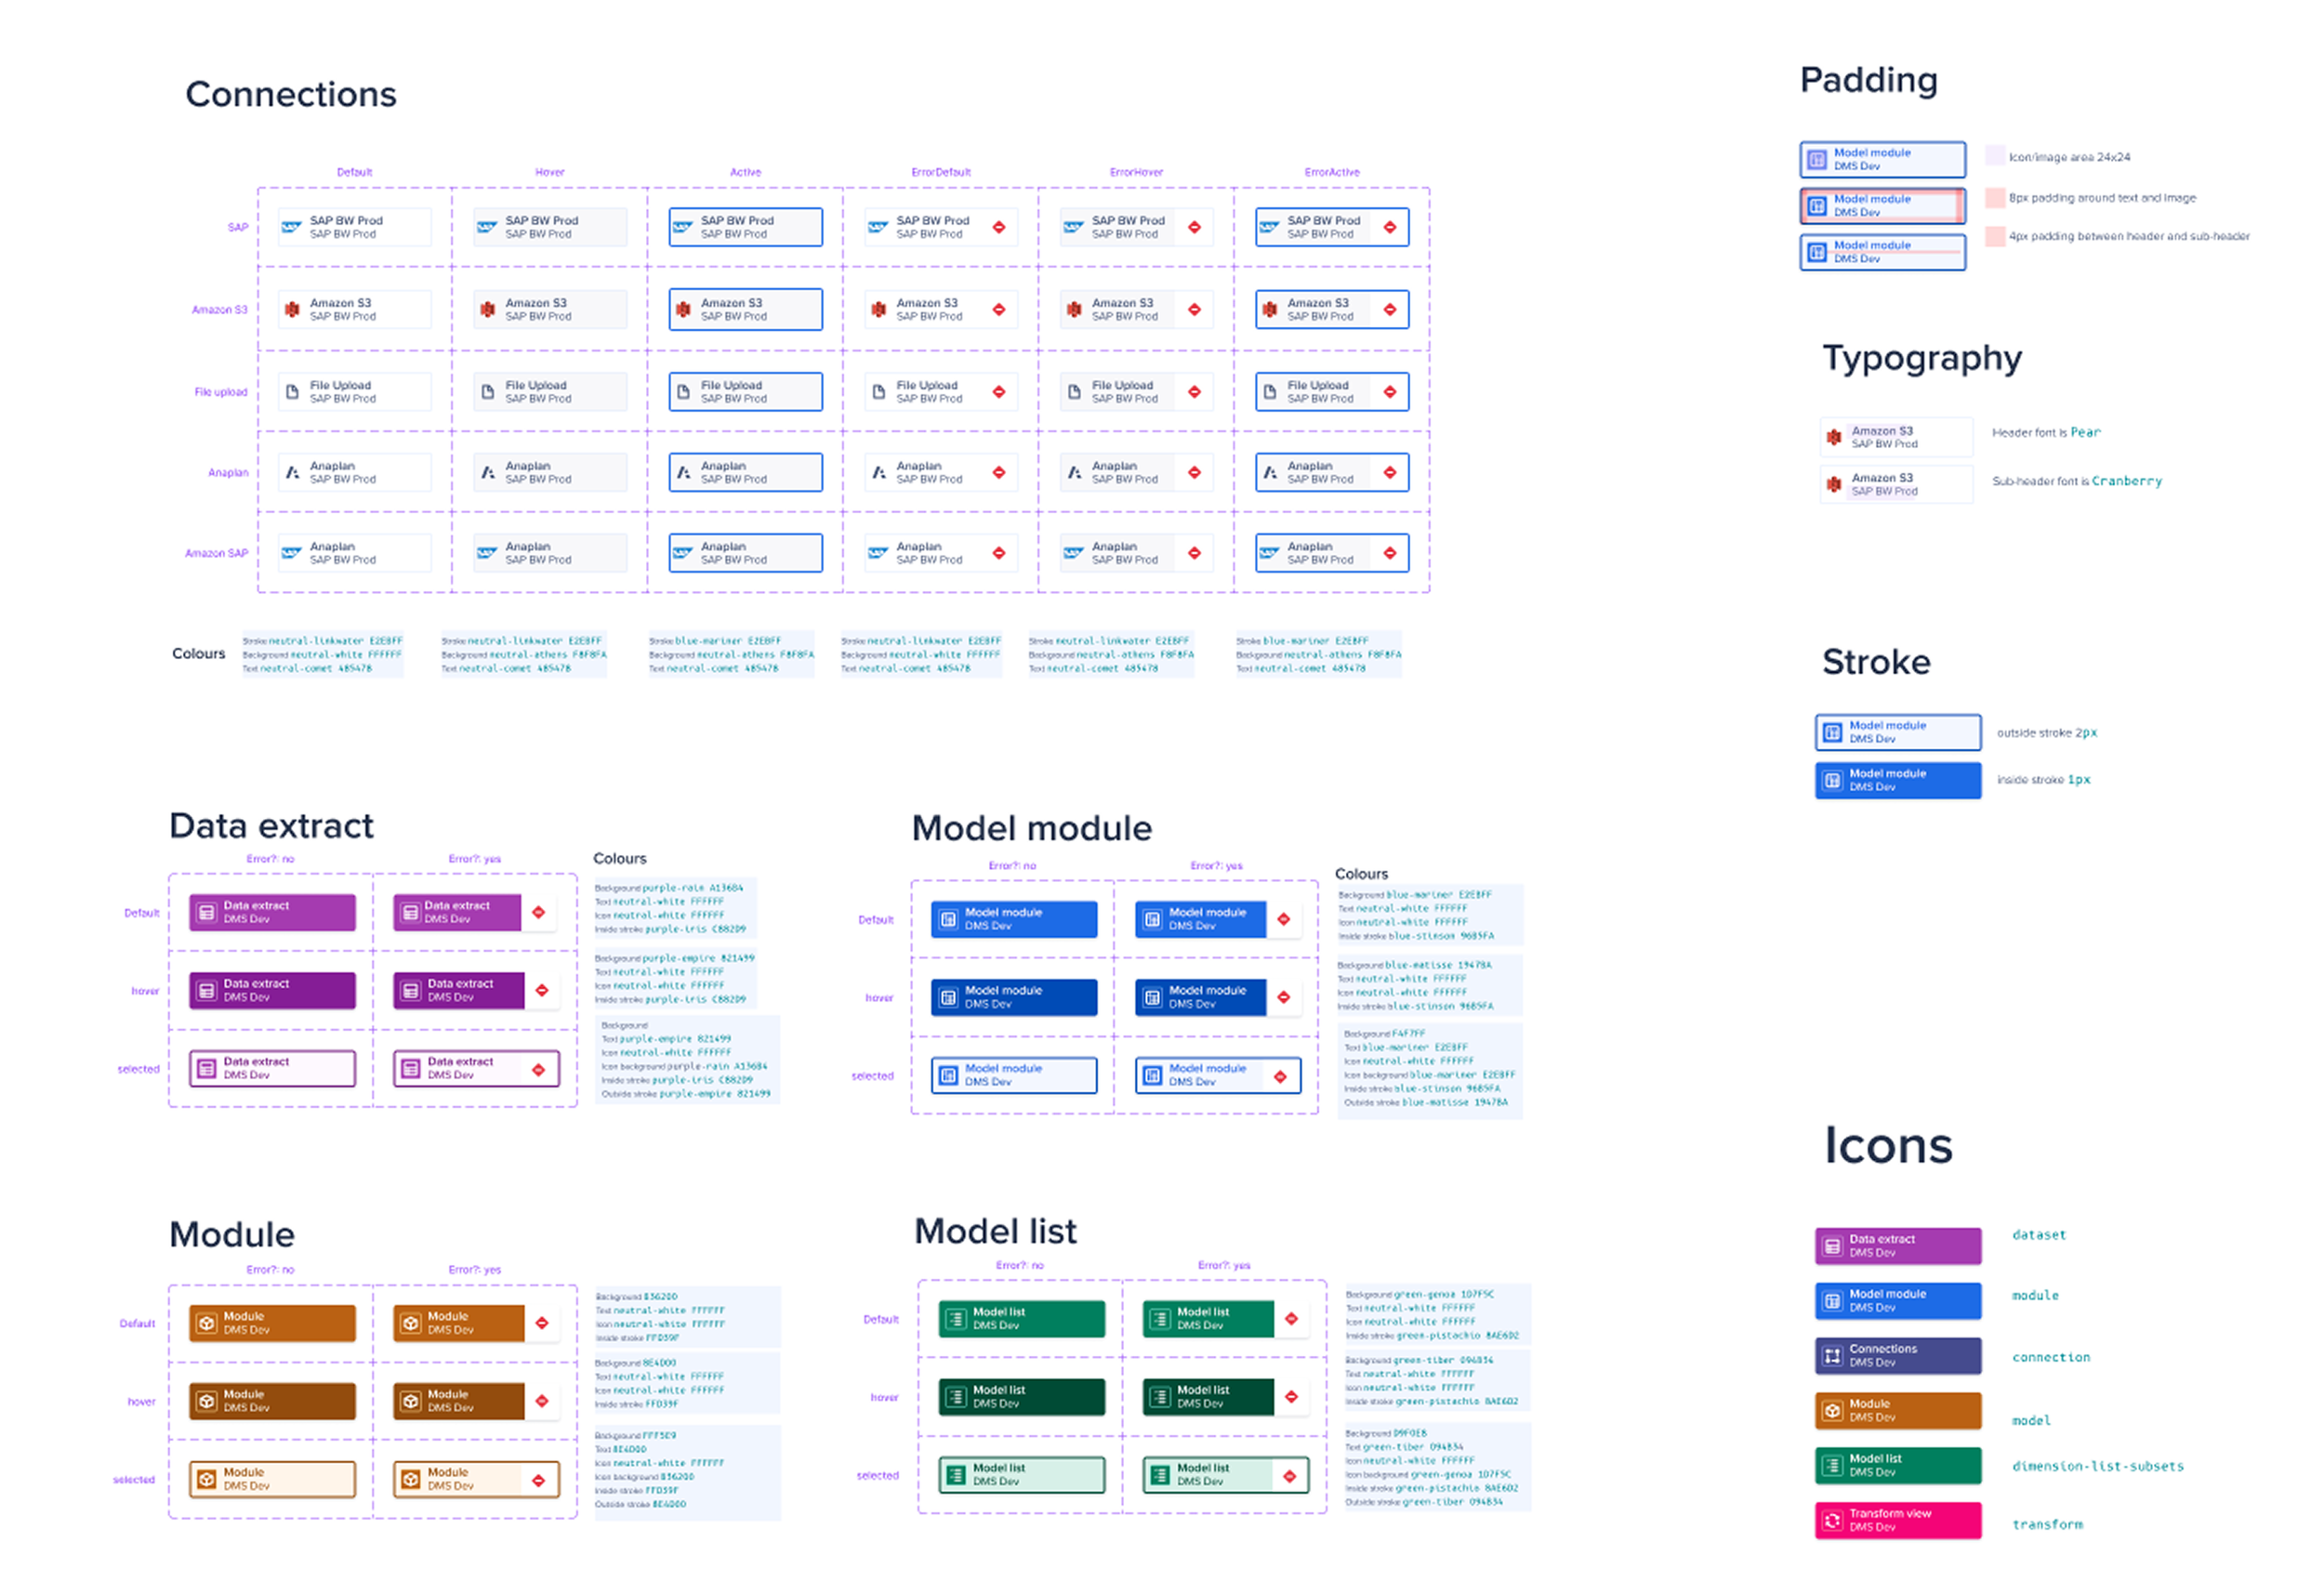
UI spec for the data map cards
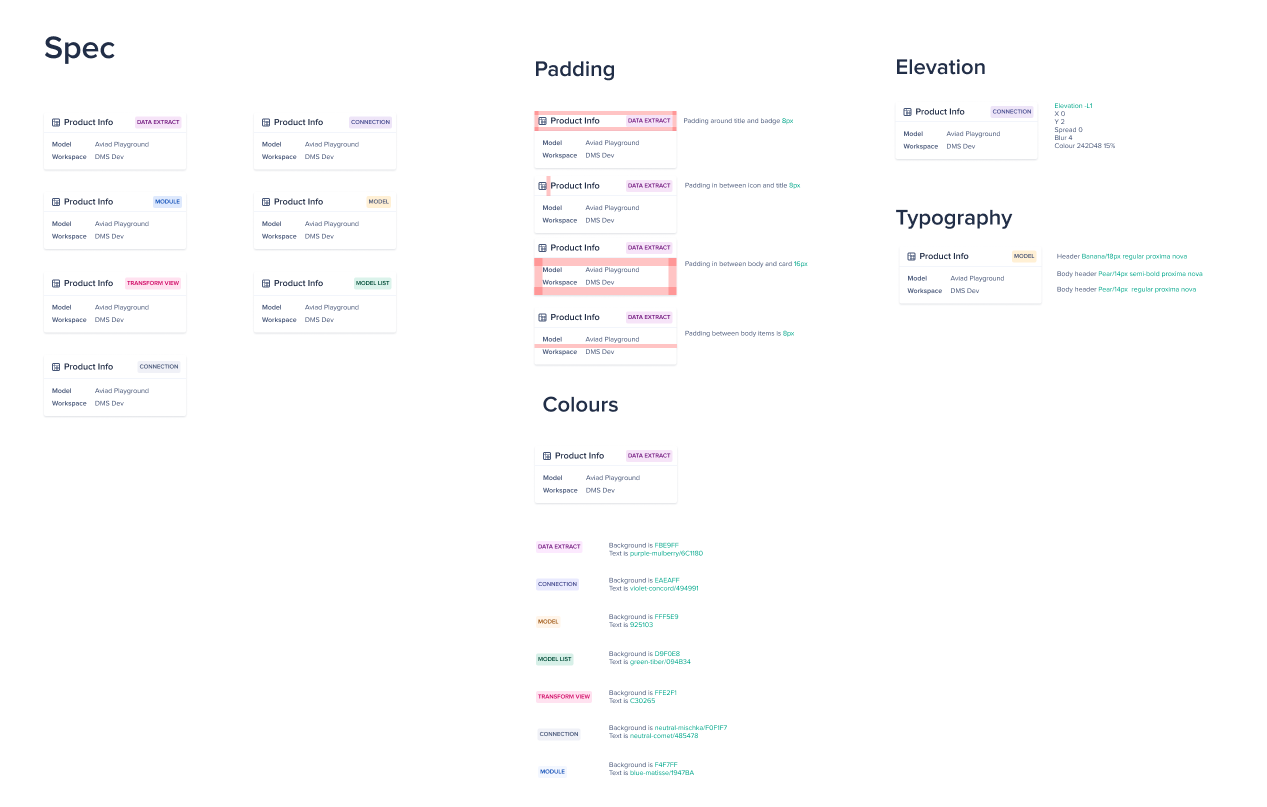
UI spec for the data map hover cards
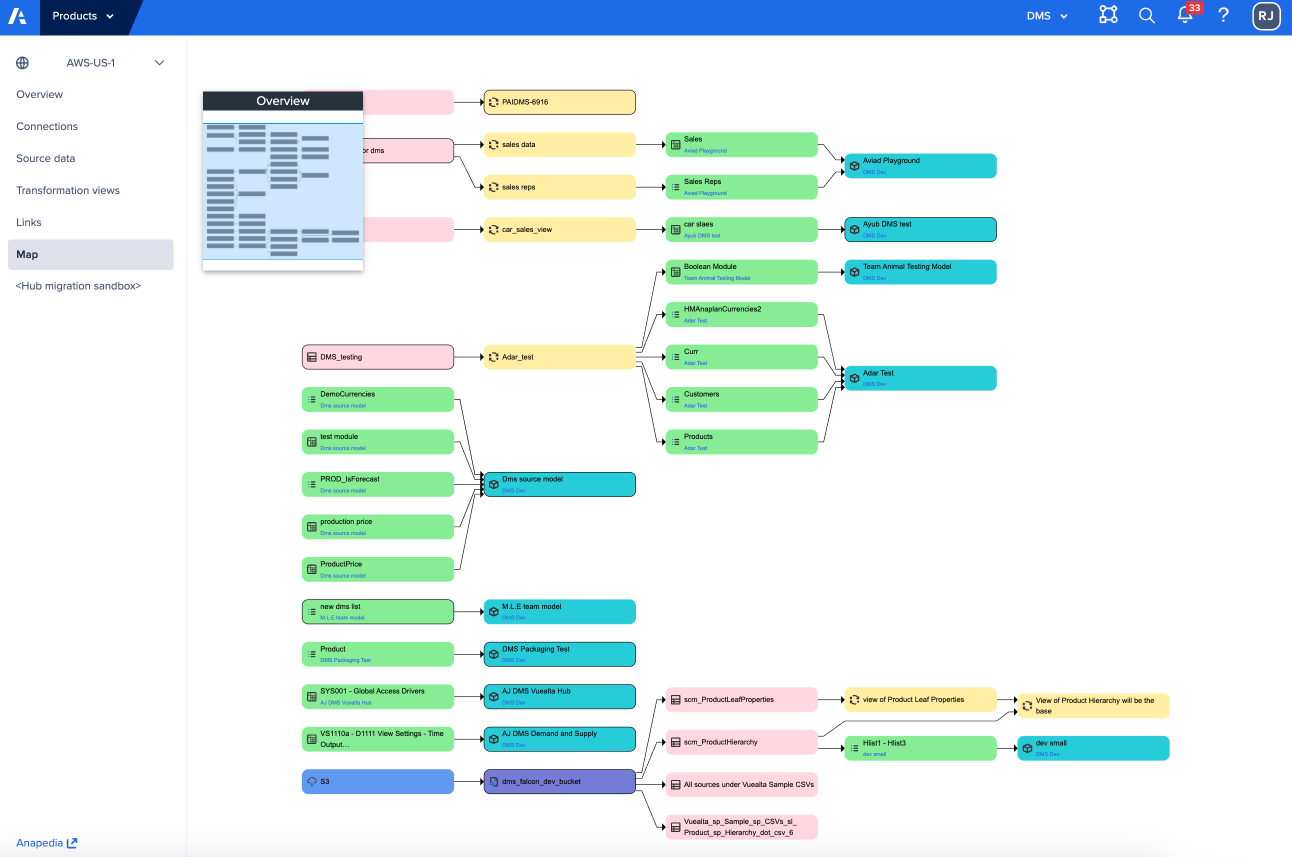
This was a very large scale and complex feature to make usable, inclusive and accessible. It had to be delivered very quickly and meant we would have to rely on customer feedback post release. I had to rely on in person workshops to gather quick feedback from the UX team and deep dives with product management and engineering. This was a project where I had to have difficult conversations when advocating for usability, as time was stretched and engineering had created the POC. Through the presentation of prototypes and walking teams through ideas I was able to convince the teams to go forward with a more user-centred design approach. By working with our User Research function we were able to convince them on the importance of testing these features in early release before going to general release. We were able to test the feature an customers were satisfied with the present functionality, but requested better filtering abilities going forward and a better starting point as the map is very overwhelming. This helped us to show the value of user feedback as it would take more time and engineering to go back and change the map than if we had spoken to users earlier. As a result, going forward on other projects we had more time to wireframe and present ideas to engineering and gather feedback from users before engineering on a feature began.
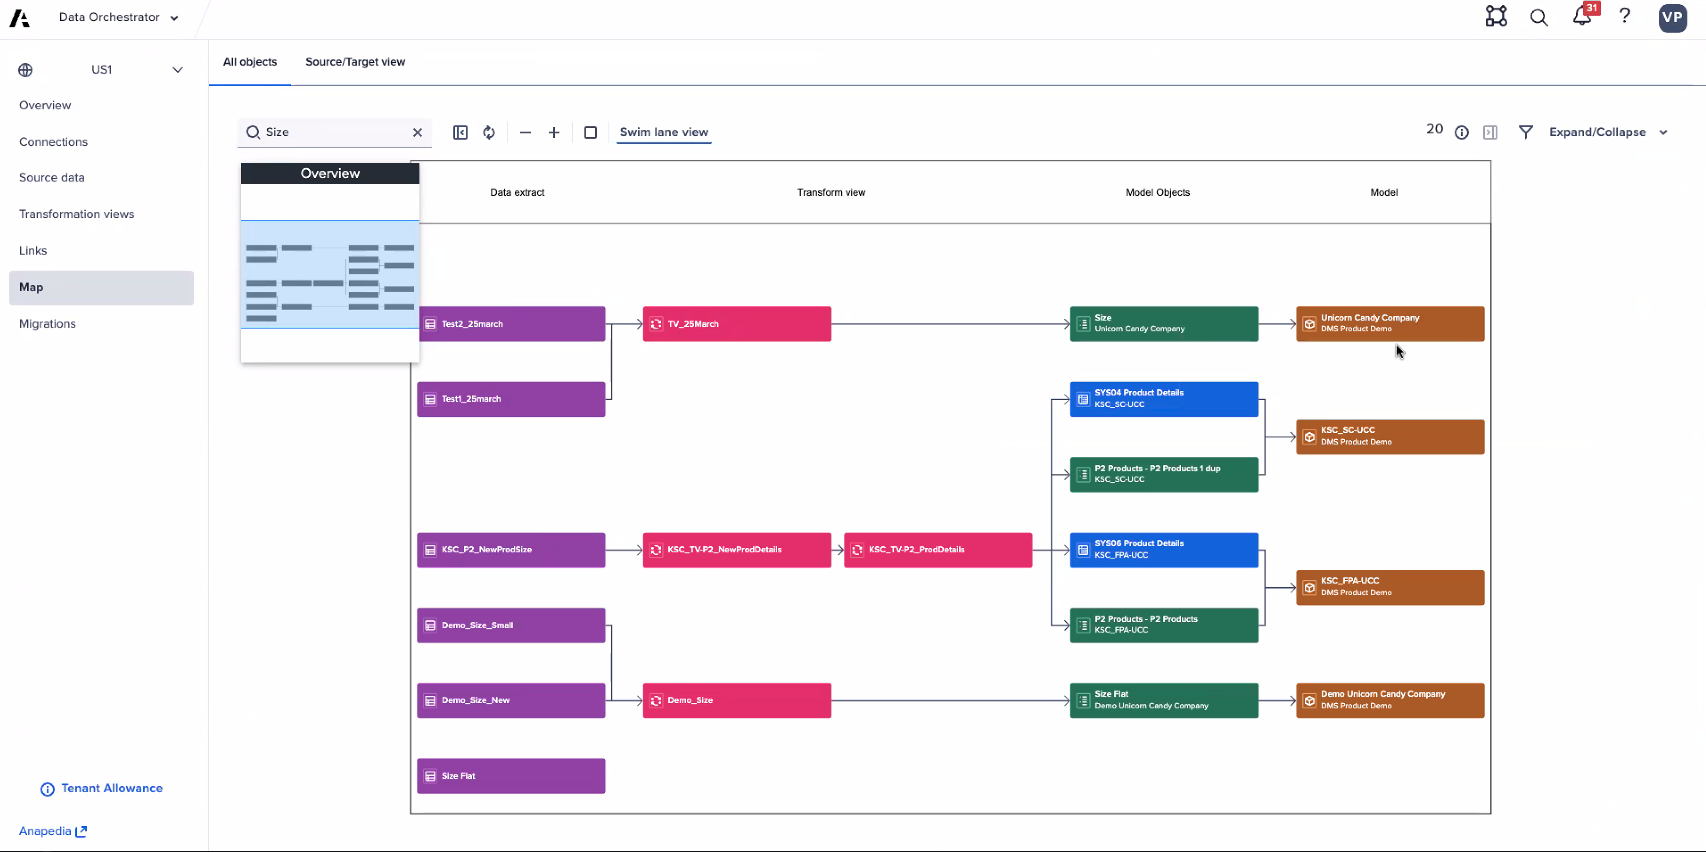
Improved swim lane view added after customer feedback.
Overall in this project we were able to remove two massive pain points for our customers when using Anaplan:
I helped to create an understandable and easily digestible visual map of their data flows in the product so taking the mental load off of their own technical staff
I helped solve the issue with the massive scale of their data by adding filters, swim lanes search and progressive disclosure. This was extremely important when we were managing around 90,000 integrations a day.
Feature deep dive
Data Orchestration
A big gap in Anaplan’s functionality was giving users visibility on how their processes running. Users would start processes and only know that something had failed when they didn’t see the changes they expected implemented, or when something broke entirely. They had to spend hours manually checking spreadsheets or raw data to see if what they had expected to happen had happened. This was a massive time and effort drain on our customers, taking weeks out of our users normal duties. So what we needed to offer them was a way to run their processes automatically (orchestration) and to schedule them - but also to be able to see the results.
However, to make this happen in Anaplan we needed to work across our own product area and another team who already had a scheduling capability. As a result, for the scheduling part of this solution I pair designed and led research with one of the other teams designers. We gathered results, completed analysis and then iterated on the designs. However, as we were using a third party software for scheduling it turned out we couldn’t implement the scheduling vision we originally wanted.
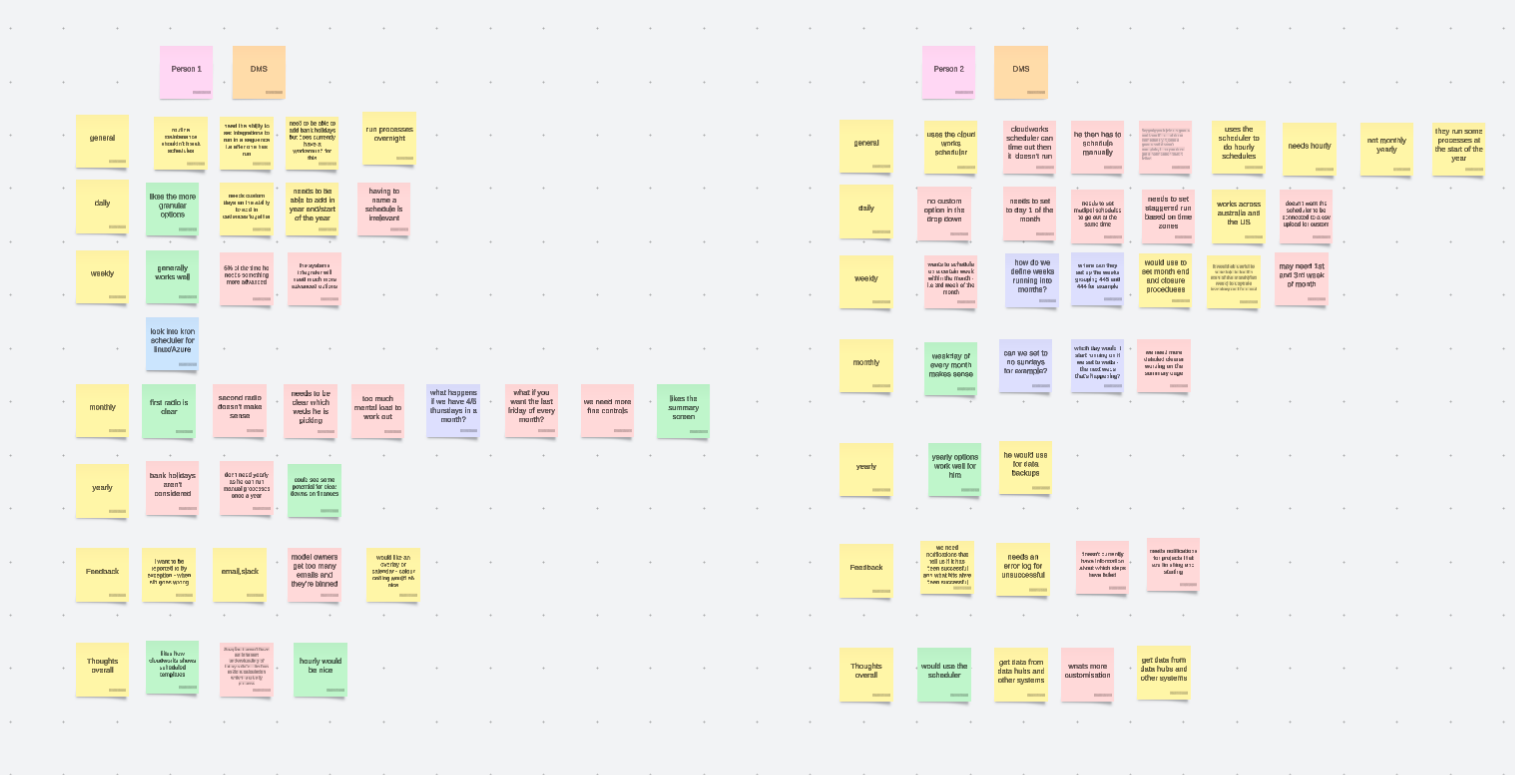
Analysis of feedback from users
As a result, we created a new scheduler design and then had to go through another round of testing to make the new UI as user friendly as possible with the limitations we had on the UI. Users now had the flexibility they had wanted for years when scheduling their automated events and reminders in Anaplan. They could finally manage their events against their financial calendar all within one product taking the mental load off of them. Additionally, they could schedule their automated integrations using just Anaplan and they no longer had a dependency on 3rd party ETL tools. This meant the customer would save millions, but they would also bring that revenue into Anaplan now. It also saved our customers many hours setting up ETL tools and removed the single point of failure if a technical person left the organisation and someone else had to learn the automations. Our solution was simple enough for business users, but also gave model builders, integration specialists, analysts and solution architects the complexity that they needed.
For the event visibility piece, I was able to wireframe and test solutions internally. I then worked with engineering to create our initial MVP version, but to help them to understand the final vision piece we wanted to to build. This was huge as it meant customers could finally track the success and failures of their integrations without having to manually check data or run API calls. It was crucial for Anaplan as it meant customers gained trust in this product. They could now trust whether their integrations had taken place or not. This gave them the reassurance and security they desperately needed. I worked with another designer to set up event Orchestration in our Workflow product, and as they were junior I heavily supported them in pair design and attended their meetings to explain our requirements to their engineering team, and help with any difficult conversations. This helped harness existing product functionality saving the engineering team many sprints of effort, but also allowed customers to use an area of the product they were familiar with and making it easier for them to use our orchestration system.
After feedback, future developments were to continue to work towards the final calendar view and to integrate the workflow UI into the ADO product area.
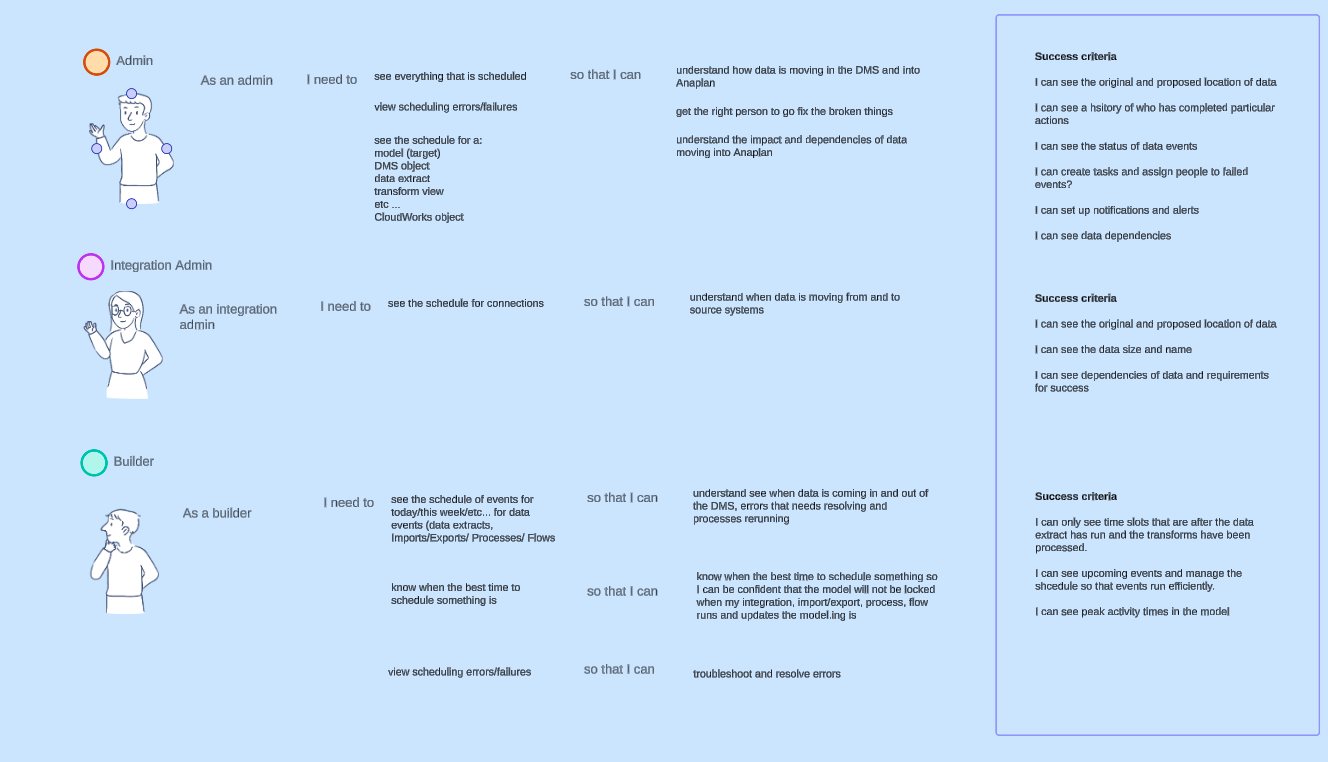
Personas created from research

Wireframes of the scheduler

Scheduler that I co designed with a designer from another team after research

Final schedule calendar view and the Orchestration workflow builer
Overall this project helped solve our customers pain points bu giving them":
a totally customisable scheduler where they can finally schedule events in Anaplan based on their own unique financial calendars
they can carry out end to end data orchestration in Anaplan removing reliance on 3rd party ETL tools
we introduced filters and only showed data based on an individual users workload to help manage the scale - initially this was a simple list with view to working towards a full calendar piece